Measure first.
Then show it.
A side-on video of a lift goes in. Bar speed per rep comes out. Right now this page shows what we have measured honestly — not a chart we cannot yet earn.
"This demo is honesty-first: every figure below is either measured by our own pipeline or labelled as unverified."
That is the whole product promise. Everything else is interface.The claim, in one line
Bar speed is the honest measure of fatigue —
it drops before your form does.
The pipeline, measured not asserted
The finding that changed the plan
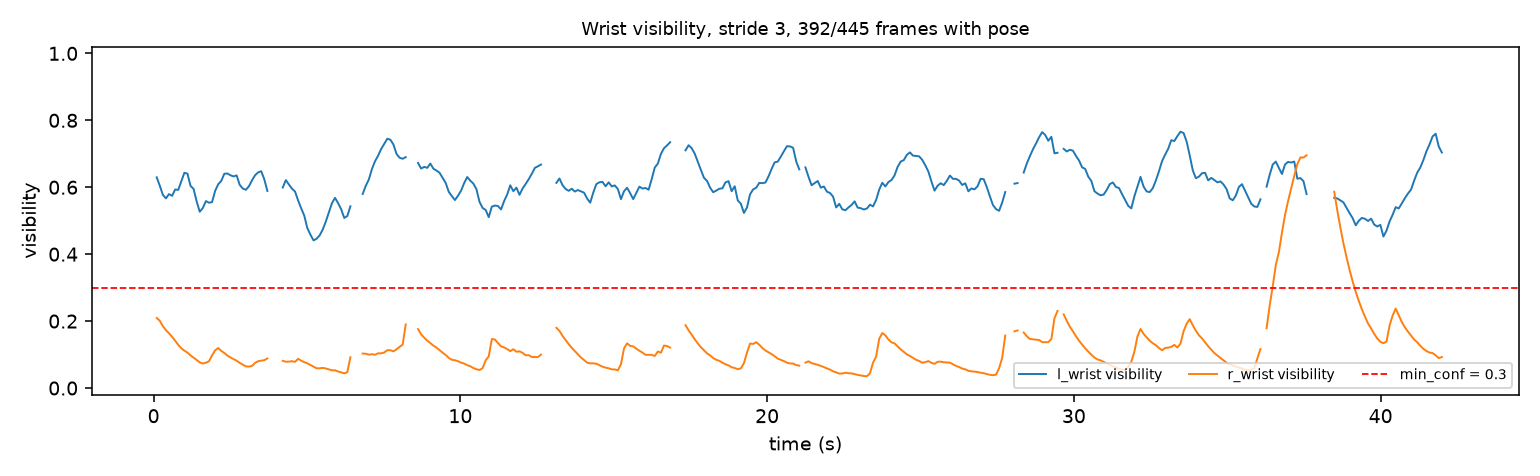
In a side-on view one hand is always behind the body. So the obvious way to track the bar — average both wrists — fails almost completely.
| confidence rule | near wrist | far wrist | either | both |
|---|---|---|---|---|
| 0.1 | 100.0% | 50.8% | 100.0% | 50.8% |
| 0.3 | 100.0% | 5.1% | 100.0% | 5.1% |
| 0.5 | 95.9% | 2.8% | 95.9% | 2.8% |
| 0.7 | 11.2% | 0.0% | 11.2% | 0.0% |
At our default threshold of 0.3, both wrists are usable on 5.1% of frames — but either one alone is usable on 100.0%. So we select the wrist by confidence, never by name, and never average.
Note the last row: even the clearly visible wrist barely clears 0.7. Confidence has a ceiling near 0.79 — so "raise the threshold to be safe" would destroy coverage.
What we are deliberately not copying
The source recording reports Mean V = 0.43 m/s.
We do not reproduce this number. It is shown only because it is the one figure legible in the source recording, and so you can see what we are deliberately not copying.
0.43 m/s sustained over a ~2.6 s concentric implies roughly 1.1 m of bar travel — implausible for the lift shown. Either the app corrects for perspective in 3-D, or the figure is modelled rather than measured. We cannot see which, so we report our own measurement instead of matching theirs.
What this page does not do yet
- Upload a video — waits for the pipeline to produce real numbers
- Per-rep velocity chart — waits for a trustworthy scale reference
- Skeleton overlay on your own footage
- Live camera
Each of those is deliberately absent rather than faked. A chart drawn from invented numbers would look better than this page and mean less.
Where the numbers came from
- Pose rate and wrist table —
occlusion_check.pyrun over the source recording on 4 Nov 2026 - Rep count and period — plate tracked by disc detection plus a circle fit on the plate rim
- Source clip — a 44.6 s screen recording of an existing app, sent by the project owner. Not our own footage, which is why the one number that matters most (m/s) is missing.